Most LTC pharmacies know how many deliveries they make.
But do they know where those deliveries are concentrated, where repeat trips are happening, or which areas consistently create delivery problems?
Those patterns can be difficult to see when delivery information is spread across spreadsheets, invoices, or individual tracking records.
A delivery heat map gives pharmacy leaders a different view. Instead of looking at deliveries one at a time, it shows where delivery activity is happening across the entire service area.
For an LTC pharmacy, seeing that geography can reveal problems that delivery volume alone cannot.
Delivery Volume Doesn't Tell You Where the Work Is Happening
Consider two pharmacies that each complete 100 deliveries per day.
One delivers those medications to facilities concentrated within a relatively small service area. The other delivers the same 100 medications across several cities and hundreds of miles.
The delivery count is identical.
The operation isn't.
Geographic concentration affects:
- Driver time
- Route length
- Cost per delivery
- Number of routes required
- Ability to respond to STAT orders
A spreadsheet can tell you there were 100 deliveries. A heat map can help show whether those 100 deliveries are tightly concentrated or spread across a large area.
That matters because delivery volume without geography can give an incomplete picture of delivery efficiency.
This is also why the shortest LTC pharmacy route isn't always the most efficient route. Where deliveries are located matters, but so do the real conditions surrounding those stops.
Heat Maps Can Make Repeat Trips Easier to See
LTC pharmacies often deliver to the same facilities repeatedly.
Some of those trips are necessary. A new prescription may be ordered after the routine route has left, or a STAT medication may need to move immediately.
But when the same facilities repeatedly receive multiple routine deliveries, it's worth understanding why.
Imagine one facility appearing on the delivery map four times in a single day:
- Morning routine delivery
- Early afternoon delivery
- Late afternoon delivery
- Evening STAT
The STAT may be unavoidable.
The other three deliveries raise a different question: Could any of them have been combined?
A heat map can make repeated activity around the same locations easier to identify. Pharmacy leaders can then look deeper into whether the pattern is being caused by medication readiness, pickup timing, refill cycles, or another part of the operation.
The map doesn't provide the answer by itself.
It shows you where to start asking the question.
Geography Can Reveal Where Delivery Costs Are Coming From
Not every delivery costs the pharmacy the same amount to complete.
A facility located within a dense route may be inexpensive to serve because the driver is already making several nearby stops.
A facility far outside the pharmacy's normal delivery area may require significantly more driver time and mileage.
If both deliveries are simply counted as "one delivery," that difference disappears.
This becomes especially important when an LTC pharmacy serves a large geographic area.
A heat map can help make visible:
- Dense groups of facility deliveries
- Long-distance outliers
- Areas with frequent repeat trips
- Locations generating significant STAT activity
- Areas where routes may overlap
For example, a pharmacy may discover that a relatively small number of facilities account for a disproportionate amount of its delivery mileage.
That doesn't automatically mean those facilities should be served differently. Patient and facility needs still come first.
But pharmacy leaders should at least be able to see where the cost and complexity are coming from.
That's part of understanding what LTC pharmacies should actually measure about delivery.
A Heat Map Turns Delivery Data Into a Business Question
The value of a heat map isn't the map itself.
It's what the pharmacy can learn from it.
When delivery activity is visible geographically, pharmacy leaders can start asking better questions:
- Why are we making so many trips to this facility?
- Why does this part of our service area cost more to serve?
- Are two routes covering the same geographic area?
- Where are most of our STAT deliveries coming from?
- Are certain facilities consistently connected to late deliveries?
Those are business questions, not just routing questions.
The answers can affect delivery cost, staffing, service levels, facility relationships, and how the pharmacy structures its overall delivery model.
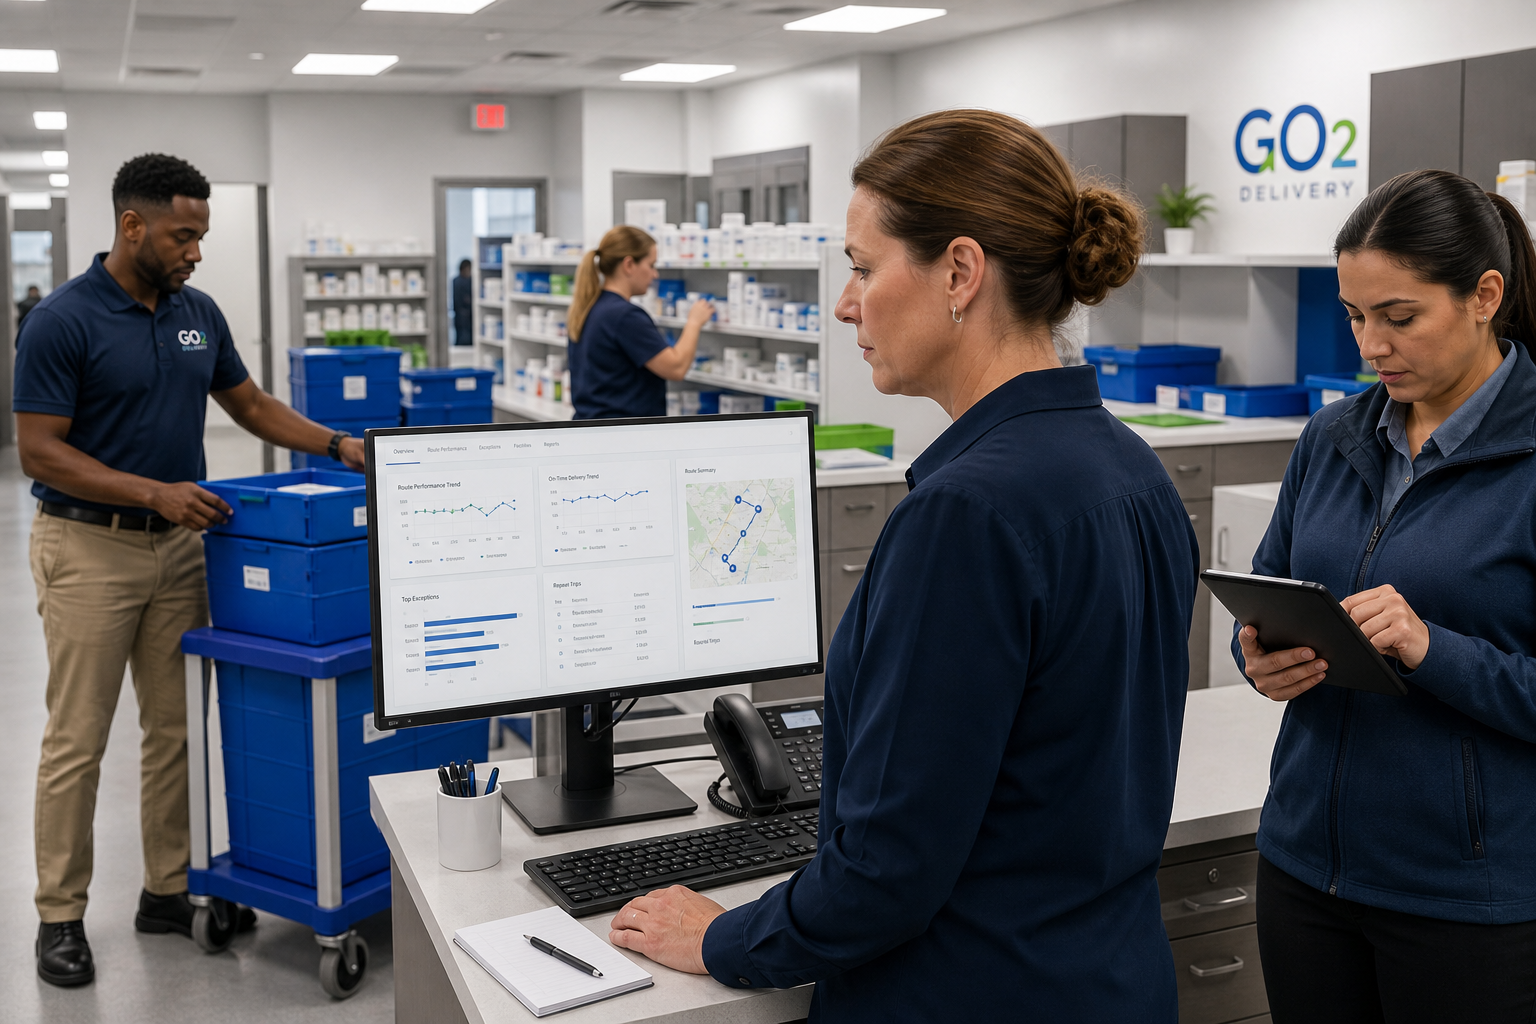
At GO2 Delivery, this is why delivery visibility goes beyond showing where an individual package is located. GO2's pharmacy delivery programs include tracking, reporting, and performance information designed to help pharmacies understand how their overall delivery operation is performing.
A delivery record tells you what happened to one medication. A heat map can help you see whether that delivery is part of a larger pattern.
Sometimes You Need to See the Problem Before You Can Fix It
LTC pharmacies can generate thousands of delivery records.
Finding meaningful patterns inside that data isn't always easy.
A delivery heat map simplifies one important part of the picture: where the work is happening.
That can make repeat trips, geographic outliers, route overlap, STAT concentrations, and other delivery patterns much easier to recognize.
The better question isn't:
“How many deliveries did we make?”
It's:
“What does the way those deliveries are distributed tell us about our operation?”
If your pharmacy has the delivery data but still struggles to understand where route inefficiencies, repeat trips, or rising costs are coming from, GO2 can help turn that information into a clearer view of your delivery operation.
Talk to a GO2 Delivery Expert
Frequently Asked Questions
What is an LTC pharmacy delivery heat map?
A delivery heat map is a visual representation of where pharmacy deliveries occur across a service area. Areas with more delivery activity appear more concentrated, making geographic patterns easier to identify than they may be in a spreadsheet or delivery list.
What can an LTC pharmacy learn from a delivery heat map?
Heat maps can help pharmacies identify delivery density, repeat facility trips, long-distance outliers, areas with frequent STAT activity, and other geographic patterns that may affect delivery cost and performance.
Can a delivery heat map identify inefficient routes?
It can help identify where to investigate. A heat map may reveal overlapping routes, repeated trips, or unusual geographic patterns, but geography alone doesn't determine whether a route is inefficient. Facility requirements, medication-ready times, STAT demand, and delivery windows also need to be considered.